Did you lose website traffic after a Google Core Update?
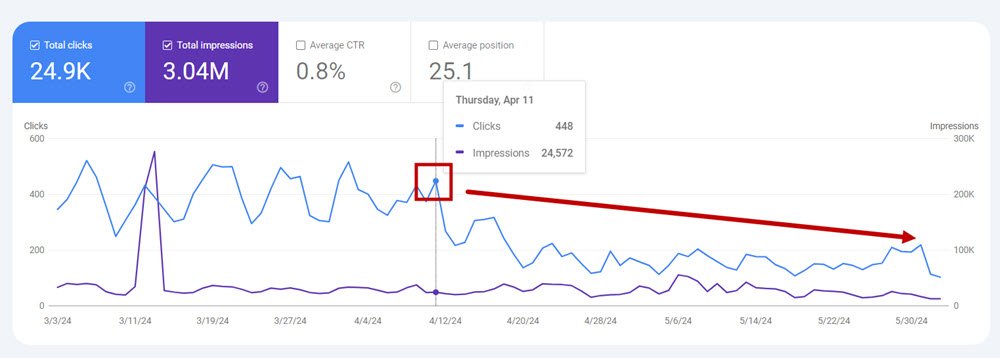
My website saw about a 50% reduction in traffic after the March update. Specifically, from April 11.
So, I wanted to understand where these drops occurred—whether it was across the entire site, specific keywords, or certain topics.
Here’s a detailed walkthrough of how I approached this analysis, the tools I used, and what I discovered.
Table of Contents
ToggleTools I used for the analysis
The only tools I used were
- Google Search Console
- Semrush
Google Search Console because, well, it’s data straight from the horse’s mouth.
Semrush because I am a big fan as you might know. I use it for all my SEO work as it gives me so much in-depth data.
But you can use any other tool for it as well.
Pro tip:
If you do use Semrush for this, you will need the Guru plan to access all the features.
You can get a 14-day trial to do the analysis.
Ok, let’s get started!
There were 3 kinds of website traffic performance (drops) I wanted to analyze:
- Topics
- Countries
- Keywords
As you know, topical authority is important for your brand and SEO.
So, I wanted to focus on topics more than keywords.
I also get traffic from multiple countries, so I wanted to know where the drop was coming from.
My last priority, but still a priority, were any specific keywords I wanted to analyze.
Here’s the full video.
Topical traffic analysis
Here’s how I analyzed the drop in my traffic per topic, and how you can do the same.
Step 1: List your main topics
If you haven’t done it already, write down the main topics of your site, and the keywords associated with each of them.
In other words, ensure all your keywords fit within a topic.
This categorization helps in pinpointing exactly which topics are losing traffic.
My topics, for example, are
- Branding
- SEO
- Website optimization
- Affiliate tools like Semrush and Canva
Step 2: Assign tags in Semrush
Make sure that the keywords you are already tracking in Semrush have a tag assigned to them with the name of the topic.
If you haven’t done it already, do it now.
Review your keywords, check which topic they fall under, and assign the tag.
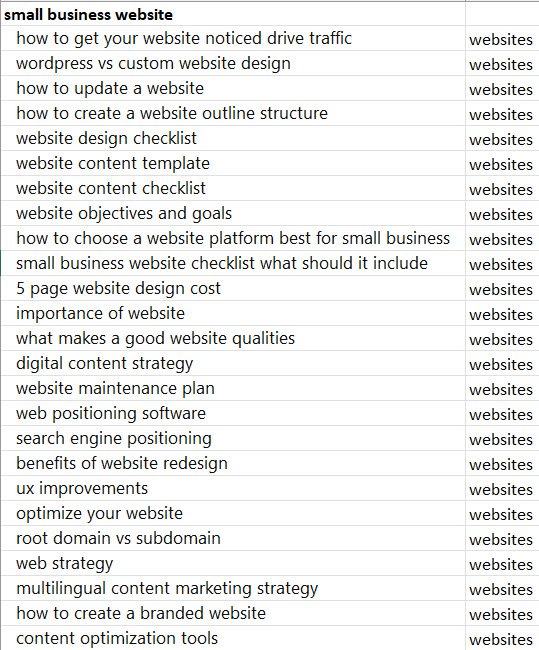
This is an overview of my website design topics, for example.
Step 3: Compare data pre and post-update
Check in GSC the date from when you started to lose traffic and drop in positions.
Mine was April 11, for example.
Now go to Semrush Position Tracking and select Tags (you will need the Guru plan).
Then, you will see the positions of all your keywords and traffic across topics.
![]()
In my case, the positions of my WordPress posts and keywords increased, but my branding posts lost visibility.
Geographic Impact Analysis
Next, I wanted to see if the traffic drop was global or concentrated in specific regions.
I saw that, for me, the traffic drop was not limited to one region but was noticeable across multiple countries, including the US, India, and Canada.
Step 1. Analyze data by country
Check the drop (position, clicks) by country in GSC.
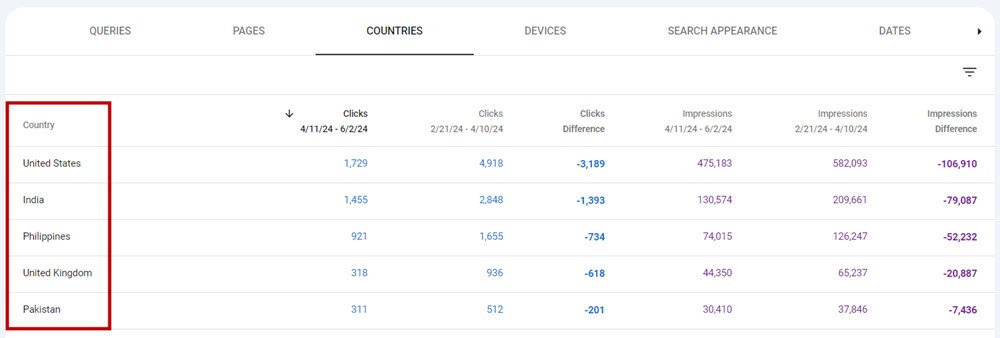
You can also check drop in one country vs another.
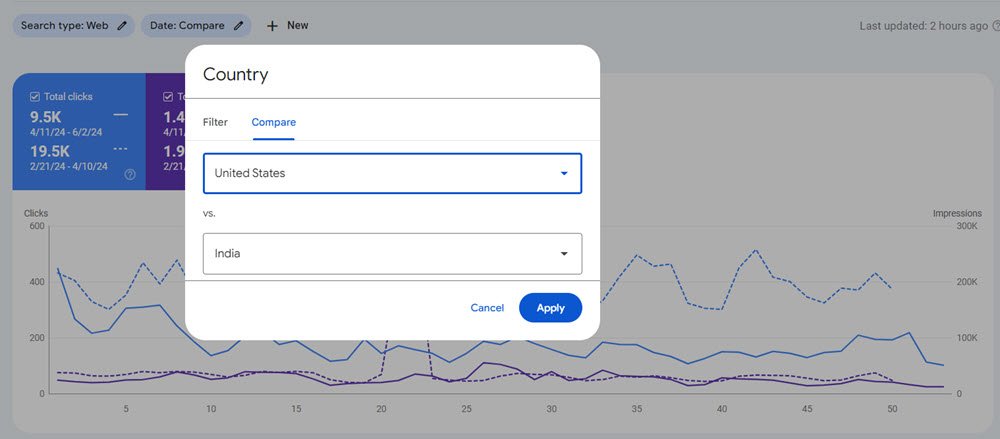
But it is limited to only 2 countries.
However, to analyze website traffic performance by country by topic or to compare the performance of multiple countries simultaneously, you must go to your SEO tool.
This is because not all your topics rank the same or are affected the same in each country.
Step 2. Compare traffic by keywords by country
Semrush lets you set up multiple projects, so I had set up all the keywords I wanted to track by country for desktop & mobile.
Then, I assigned tags to them.
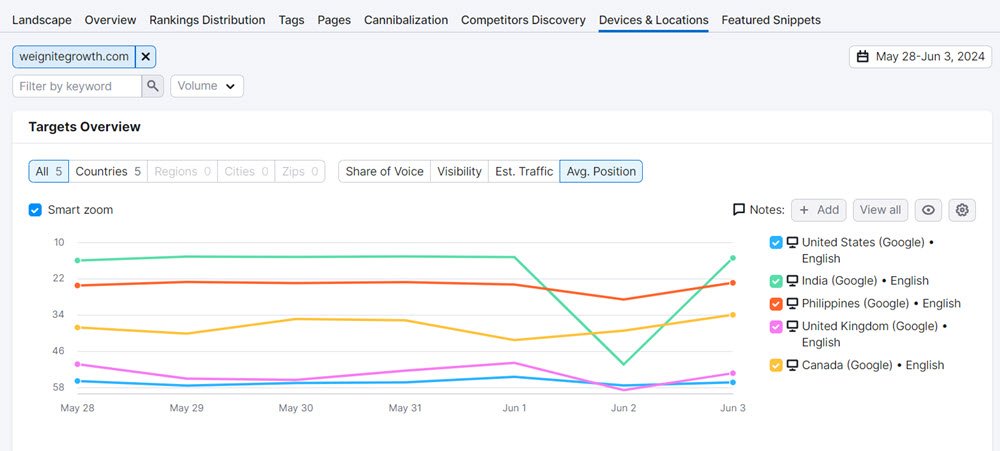
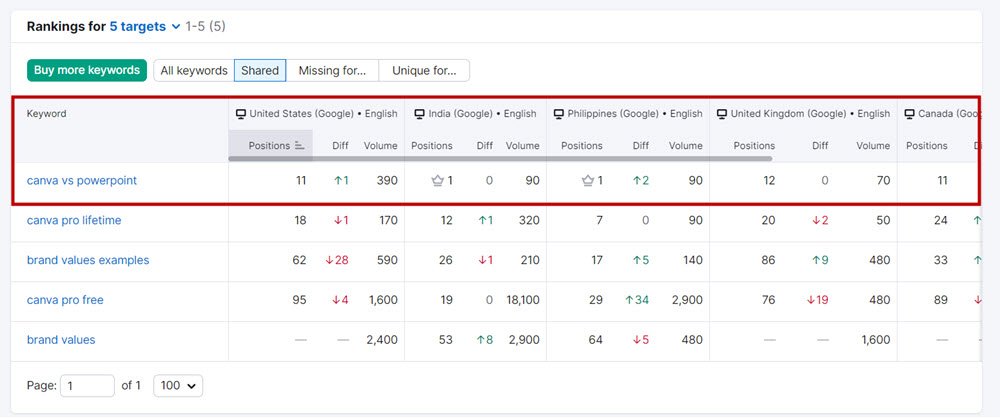
Now, to track the performance, I click on Devices & Locations.
Here, some keywords are shared across countries, and many are unique.
So you can see 2 things:
1. Snapshot of the performance across countries
2. Ranking of the same keyword across multiple countries
That’s a quick overview of how I compared traffic performance across countries.
Detailed Keyword Analysis
The third angle of my analysis focused on the keywords. Which ones were losing traffic? Were they transactional, informational, or a mix?
This is where Semrush was particularly helpful.
I found that certain keywords, especially those associated with transactional queries like pricing or subscriptions for tools like Canva, were significantly impacted.
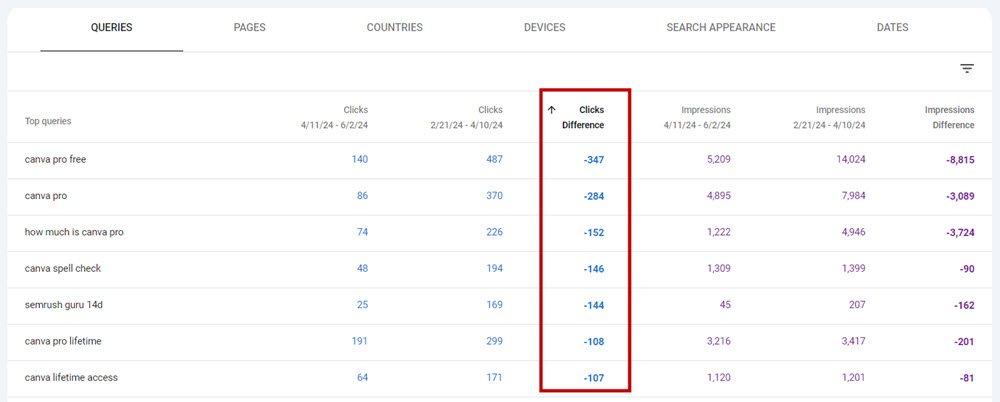
Step 1. Gather keywords from GSC
As a first step, check all the keywords you lost clicks on in GSC.
Sort them by ascending order of clicks.
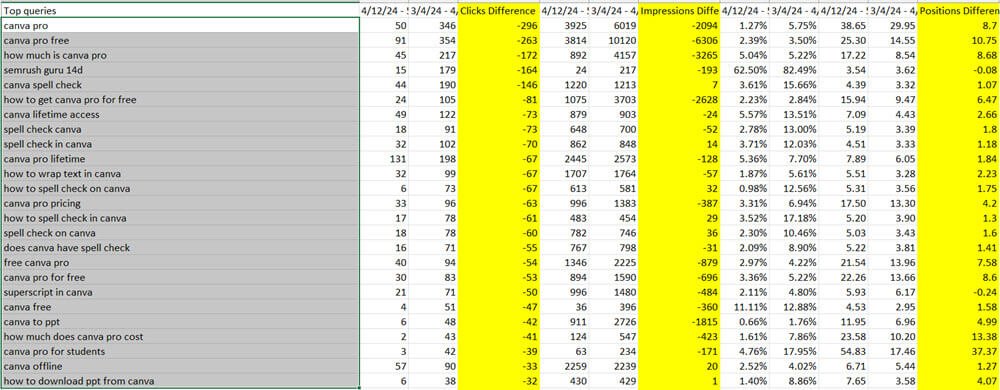
Export the file as an Excel sheet.
Step 2. Analyze keywords in Semrush
Take the first 100 keywords with click drops (or positon drops), and enter them in the Semrush Keyword Overview Tool.
You can add less than 100 as well, but 100 is the max.
Now, add all the lists to a new Keyword List.
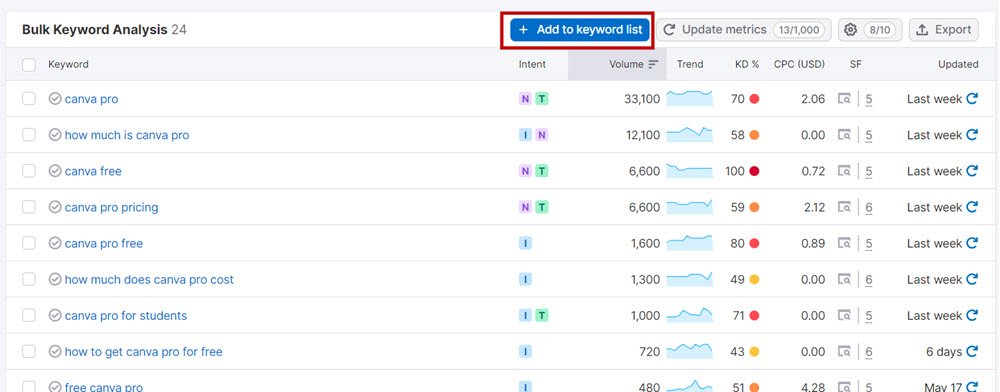
Step 3. Cluster your keywords
Click on ‘Cluster This List’ to divide your keywords by topic and sub-topic
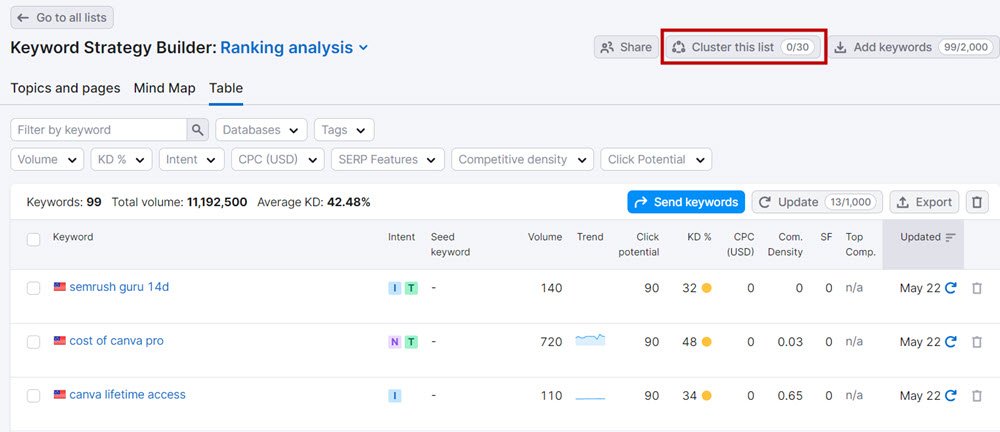
In my analysis, I see the topic I lost the most traffic and position on was ‘Canva free subscription.’ It included a mix of informational, transactional, and navigational keywords.
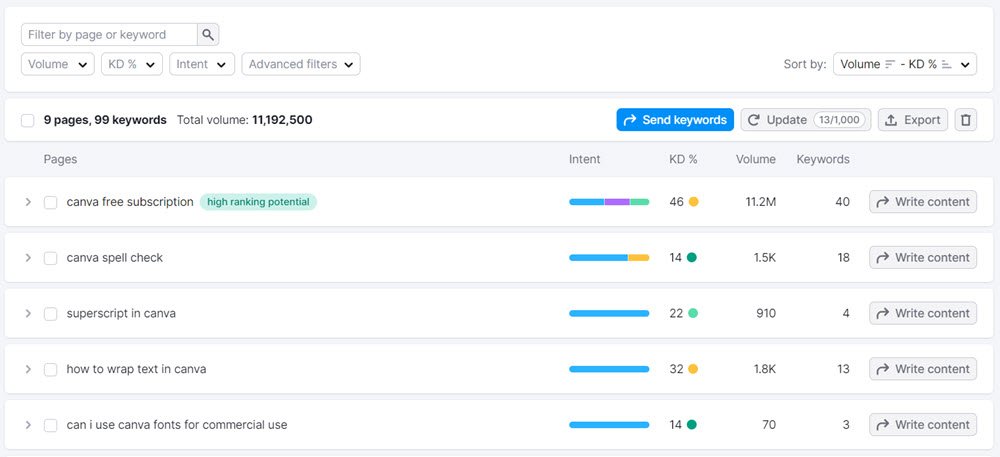
Other keywords I lost the biggest traffic on were mostly informational keywords.
Step 4. Review the SERP
Choose any keyword, especially one which was very important for you, and open it in a new tab.
Refresh the data to get the latest metrics, and see the pages ranking in the top 10.
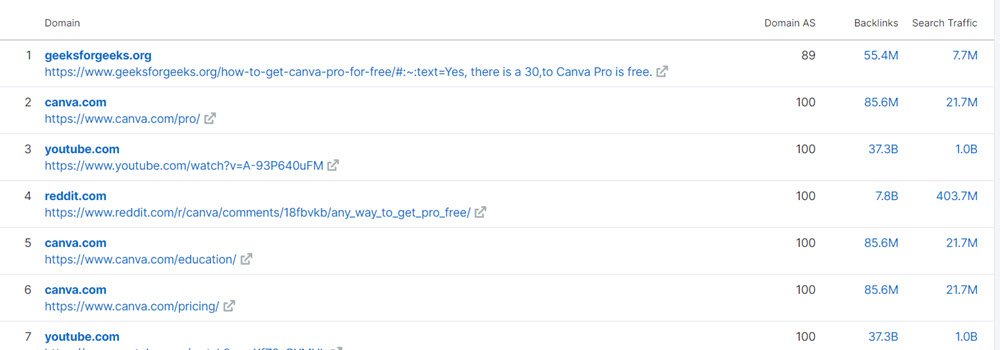
Step 5. Conduct competitive research
1. Compare content
Open the relevant pages in your browser and read the content.
- Is it better than yours?
- Have they covered any points that you haven’t?
- Have they answered additional questions
2. Compare backlinks
Do the top pages have more backlinks than yours?
Analyze by both URL and domain, to get a full idea.
3. Compare keywords
Open the Keyword Gap tool and enter your URL along with your competitors.
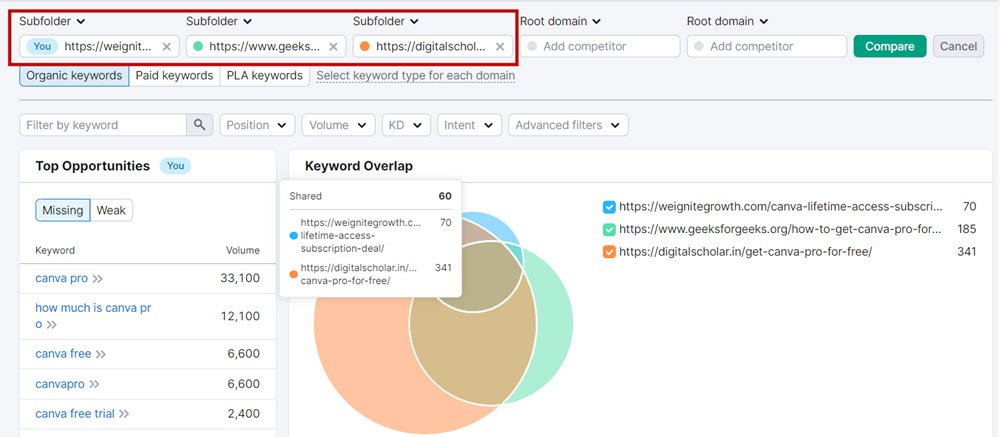
Check the specific keywords on which your competition ranks well compared to yours, for the specific URLs.
You can only compare keywords by URL in the Guru plan of Semrush, not the Pro plan. Know more about the Guru free trial.
Get a 14-day trial to test this feature.
And that’s how you analyze keyword performance in Semrush and GSC.
Conclusion
This post was just about how to analyze the traffic drops.
When you know exactly your performance dwindled, you can maybe take next steps to improve it.
Google will do what Google does, you cannot control it.
You can only measure the performance and get insights on whether your content needs to be improved, whether your need more backlinks, etc.
Let me know your thoughts on this approach!
Did you have any strategies that have worked for your website traffic analysis?


